


Jira is a data-driven project management platform that centralizes information, improves collaboration, and boosts efficiency. The first thing you’ll see when you get into Jira is your dashboard — a one-stop shop for getting a handle on your projects each day, with the freedom to dive into the data as needed. But crafting a dashboard that suits your needs, or the needs of your team, takes some thought. Get the most out of your Jira dashboard with this easy-to-use guide.

What is a Jira Dashboard?
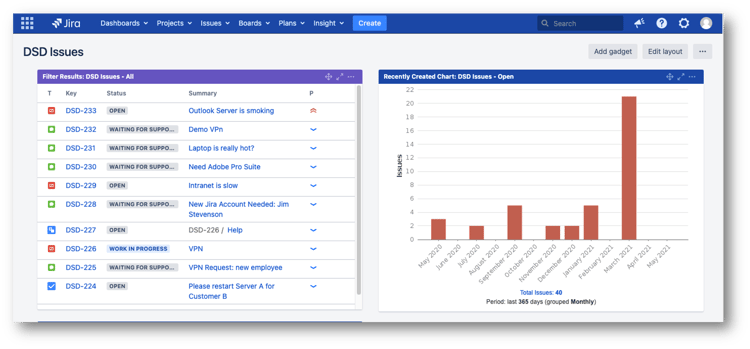
A Jira dashboard is a screen that gives a quick overview of key project data using handy tools called gadgets. Dashboards allow you to do everything from seeing where your assigned tasks stand at a glance to easily identifying bottlenecks that are preventing a project from moving forward.
Each gadget used in your dashboard is designed with a specific purpose. They might display a list of outstanding issues for the next sprint or a pie chart showing the statuses of all your assigned issues. Most gadgets present data in easy-to-digest charts, graphs, or tables.
When you log into Jira, you will see the default or system dashboard. This comes with a set of gadgets that only a Jira administrator can add or remove. However, any Jira user can create their own dashboard and configure it with relevant gadgets based on their needs.
Creating Your Jira Dashboard
Creating a new dashboard in Jira takes just a few minutes. To begin, if you’re using Jira Cloud, select Dashboards from the bar at the top of every Jira screen, then click on Create Dashboard. If you’re instead using Jira Data Center or Server, select the Create option from the “...” menu in the upper right corner of any existing dashboard.
You’ll be prompted to fill out the following fields:
- Name: Fill out the name of the dashboard. Ensure that the name you choose passes the time test. It should be descriptive, indicate its goal, and make sense even after a few years when you lack context. For instance, choose “Task Distribution: AWS Cloud Migration for Client X” over the less clear “Cloud Migration Dashboard”.
- Description: Add more details about the project here. This is an optional field.
- Shared with: This field determines the users who will have access to the dashboard. You can share it with specific groups, projects, individual users, or make it public to all. You can edit this setting at any point later to modify access.
Once you have filled out these fields, click on the Create button. You’ve now successfully created a Jira dashboard.
If you’d like to model a new dashboard based on an existing one instead, you can use the Copy option available from the “...” menu.
You can create multiple dashboards to keep things organized. However, remember that the more you set up, the harder it will be to take full advantage of the “at-a-glance” benefits dashboards can provide.
Customizing Your Jira Dashboard
You’re now viewing the dashboard you just created, which will be blank (if it’s brand new) or will display some gadgets (if it’s a copy). In either case, you can modify your dashboard layout by clicking on the Change Layout option at the top right of the dashboard page. Jira gives you a few layout options: one-column, two-column, or three-column. Further, in the two-column format, you can choose between a wider column on the left or right. The changes you make to the layout will apply to all users of the dashboard.
Choose your layout based on the number and type of gadgets you add. While you can add up to 20 gadgets in one dashboard by default, four to six gadgets are ideal, as the page can appear too crowded otherwise. Add more columns to accommodate additional gadgets so you can easily view all data they display. You can also place visual gadgets like charts at the top to get the big picture quickly, and move gadgets that provide more granular data down the page for when you want to dig in further.
You can even convert your dashboard into a wallboard by plugging a computer into a TV monitor at the center of the team area and then selecting the View as wallboard option from the “...” menu in the upper right of any dashboard. This is a great way to make data visible and transparent to everyone.

Gadgets for Your Jira Dashboard
Now you need to add some gadgets to use with your new dashboard. Simply go to the dashboard page and click on the Add gadget option at the top right. To help you get started, here are a few commonly used gadgets you may want to consider.
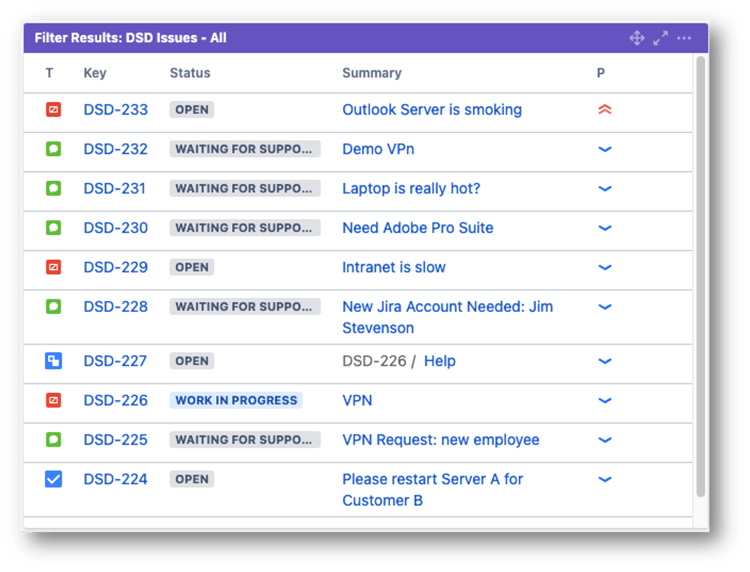
Filter Results
Jira allows you to create filters to narrow down your data search. For instance, you can specifically search for issues that relate to a particular software component or those with a certain status. The Filter Results gadget displays all the filters that you have selected as favorites. When you select a filter, you can view all the data under it.
Assigned to Me
Many developers start their morning by looking at the list of issues assigned to them. It’s a great reference for planning the day’s work. Assigned to Me displays all open issues in the projects assigned to the current user. There are many similar gadgets available as well that display the results of other Jira queries, like all in progress issues for a certain project. You can also use gadgets that let you fully customize the query whose results you want displayed.
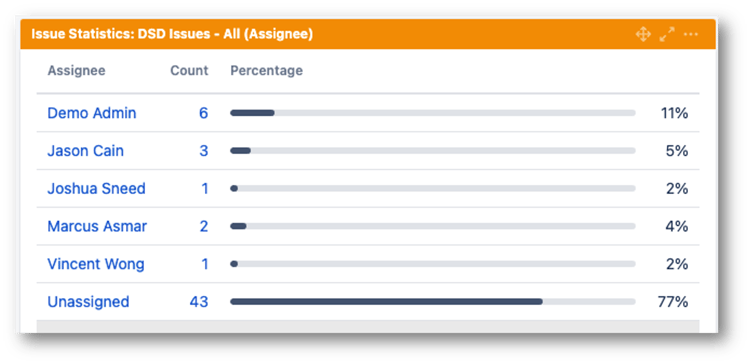
Issue Statistics
The Issue Statistics gadget is a horizontal bar graph that shows the percentage split of issues based on a particular filter. For instance, project managers can filter issues based on assignees to identify key bottlenecks. When viewing this data, project managers can ask questions like these to decide on the next course of action:
- Does one person have too many items on their plate?
- Can you deprioritize or move some issues on this person’s list?
- Are necessary skill sets concentrated in just a few individuals? If so, do you need to provide more training or change your hiring plans?
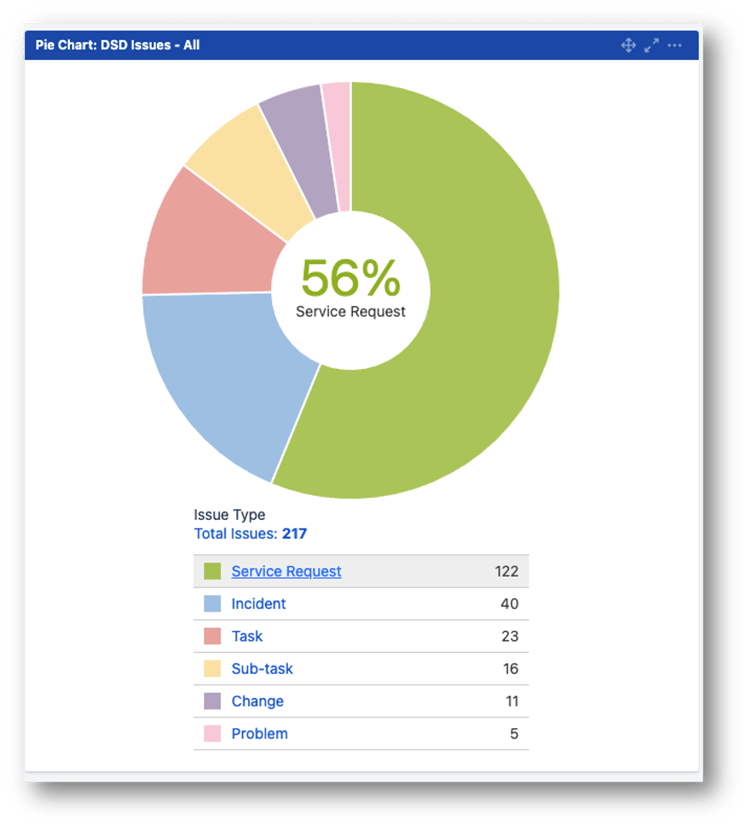
Pie Chart
The Pie Chart gadget groups data in a pie chart format. You can use any criteria you want, from issue statuses to assignees to labels. For example, grouping based on issue status gives a quick sense of what you’re waiting on. If many issues are pending testing, you may need to boost the resources of the testing team.
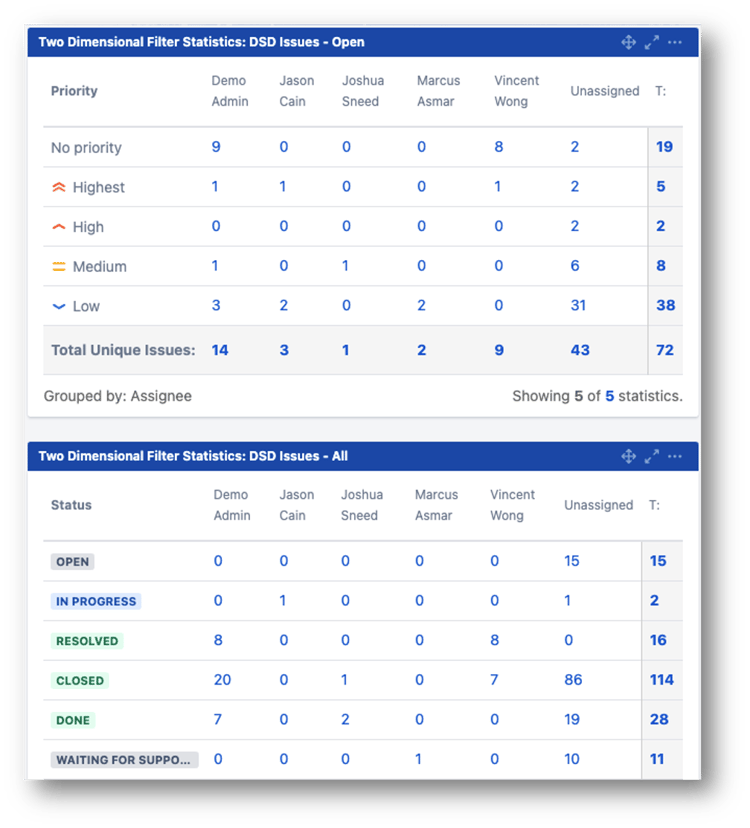
Two-Dimensional Filter Statistics
If you want a table pitting two parameters against each other, use Two-Dimensional Filter Statistics. You can show issue statuses by assignee, completed issues by project, and more. This gadget creates an interactive table that you can click on to get deeper insights.
Custom Charts for Jira
While Atlassian offers a variety of gadgets, there are many additional gadgets available on the Atlassian marketplace alongside other useful plugins for Jira. If you’re looking for a way to create more tailored visualizations for your dashboard, look at Custom Charts for Jira. It’s a powerful visual app that gives you the flexibility to create several types of charts that you can customize using a built-in search tool, JQL, and filters.
Finally, don’t hesitate to change up the gadgets you use if they’re no longer aligned with your goals or if you find a better alternative. You can also change gadget permissions to grant or restrict access to users if you want only certain portions of your dashboard to be available to others.
Beyond Dashboards: Making Jira Work for You
The strength of Jira lies in the ability to customize the user experience, and dashboards are no exception. But as empowering as this ability to customize can be, it requires familiarity with all of Jira’s many capabilities.
That’s why an experienced Atlassian Platinum Solution Partner like Contegix can help. The experts at Contegix can help you optimize your entire Jira deployment and assist your team with everything from initial setup to aligning dashboards and reporting with your business needs. Before you know it, your team will be tackling their projects like never before thanks to the easy access to key data and insights Jira dashboards can provide.
Contact Contegix today to learn more about how its team of experts can help you maximize the value of your Jira deployment.