


Organizations across industries rely on Jira’s reporting capabilities to deliver data in accurate, easy-to-understand ways, so they can see how projects are progressing and better achieve their business objectives. Jira is a robust tool that can deliver game-changing insights, but aligning its reports with your organizational needs comes with its share of challenges. This is your walkthrough for getting the most out of Jira reporting, from its potential benefits to generating and customizing a wide variety of reports.

The Benefits of Jira Reporting
Jira’s reporting capabilities are a key part of its value proposition. Reporting takes the value of your Jira deployment to the next level by providing crucial insights in real time—enabling your team to make meaningful, data-backed decisions that boost productivity and performance. Analyzing the status of each project is essential for meeting goals and managing workloads. Jira reports can help teams rapidly identify and ameliorate workflow bottlenecks, bandwidth issues, and performance problems, empowering them to stay on top of their short- and long-term tasks.
It’s important to note that Jira offers several different types of tools and reports to help you gain visibility into your team’s progress, each with various benefits, limitations, and uses. Each organization or team should use the reports and tools that best align with what they want to understand, measure, and improve. The reports that provide the most value for a kanban team, for example, will differ from those that will be beneficial for scrum teams or those focusing on issue analysis, as each will need to visualize and analyze different aspects of their work. But whether your team needs to monitor their goals, investigate issues, shed light on incoming work, or assess their backlog, there’s a Jira report that can serve your intended purpose.
How to Generate Jira Reports
Jira offers a variety of reports by default, each of which displays different information regarding your project, versions, sprints, epics, and issues. But before we dive into each type and how they can empower your team to optimize their operations, let’s walk through the brief process of generating a report.
To configure a report using Jira Server or Data Center, follow these three steps:
- Locate the board you’d like to generate a report for, and click “Reports” to display your most recently viewed report.
- If you’d like to view a different report, click “Switch report.” Note that the reports found in this list apply specifically to agile development.
- To view reports that are not specific to agile development, click “All reports” from the “Switch report” dropdown menu and select a report that is not in the “Agile” section.
Teams using Jira Cloud can generate a report using these three steps:
- Locate the project you’d like to configure a report for.
- Select “Reports” from the project sidebar to find the reports overview page.
- Choose a report from the sidebar or the overview page to start generating a report.
Gadgets and the Dashboard
In addition to manually generating reports, teams can use Jira dashboards and gadgets to keep key metrics easily accessible at all times. Jira dashboards enable users to track, manage, and update their daily work in a single, user-friendly display.
Each dashboard can be tailored to the user’s needs and preferences with custom gadgets. These gadgets are dynamic tiles that summarize project and issue data by filtering information. They make it easy for team members to organize and access their tasks by providing quick and seamless shortcuts from the dashboard to relevant projects and tools.
Because Jira dashboards — and the gadgets displayed within them — offer a real-time, interactable, and customizable view of your work, they’re a powerful tool for visualizing progress. And with filters that make configuration easy, you can quickly find, update, and evaluate issues across every relevant project.
There are several pre-installed gadgets available to any Jira user along with a variety of downloadable gadgets from the Atlassian Marketplace. Here are a few of the most useful Jira gadgets available by default:
- Activity Stream Gadget provides a quick overview of a user’s recent activity.
- Assigned to Me Gadget displays the user’s open issues in all projects assigned to that user.
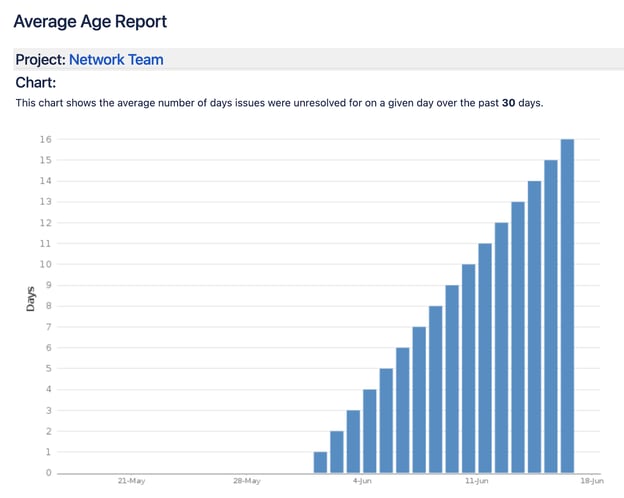
- Average Age Gadget provides a bar chart that illustrates the average number of days that a user’s issues have been unresolved.
- Average Time in Status shows the average number of days a user’s issues have spent in a particular status.
- Issues in Progress Gadget displays all of the user’s assigned issues that remain in progress.
Team admins can also add custom gadgets that further personalize the way projects and issues are displayed. To add a new gadget to your dashboard, make sure you’re logged in as a Jira administrator, then follow these steps:
- Find the relevant dashboard by clicking the “Dashboards” link in the navigation bar, and select “edit.”
- On the dashboard, select “Add Gadget.”
- Using the gadget wizard, find and select the gadgets you’d like to add to your dashboard.
If none of the available gadgets suit your team’s needs, you can also develop new gadgets of your own by writing an XML descriptor file.
Jira Reporting Plugins
Jira has attracted a plethora of third-party developers who have created plugins to extend the platform’s functionality. These add-ons increase the value and flexibility of Jira across a multitude of use cases, and reporting is no exception. Before investing in a reporting plugin, evaluate its features and costs against your team’s objectives. The right plugin can help your team build advanced reports, connect and utilize project information from a variety of sources, and better visualize the rich project data available in Jira.
Of course, sifting through all the available add-ons can be a time-consuming, burdensome task for busy teams. To streamline your search, start by consider these popular Jira reporting add-ons:
- BigGantt. With an intuitive drag-and-drop interface and powerful filters, BigGantt helps Jira users take the flexibility and functionality of traditional Gantt charts to the next level. Teams can use BigGantt to clearly measure their progress against established timelines.
- eazyBI Reports and Charts for Jira. A powerful business intelligence tool, eazyBI lets experienced users generate flexible reports on just about any data point they desire. Data can be pulled from other sources too, not just Jira, allowing you to report on all aspects of your organization’s work in an incredible amount of detail.
- Custom Charts for Jira. Sometimes you just want a quick, simple chart for your weekly standup. Custom Charts lets both beginners and experienced users make customized reports directly on the Jira dashboard. With a no-code, drag-and-drop interface, teams and managers can get at-a-glance overviews of progress in line, bar, tile, and pie charts that take seconds to make and share.
- Tempo Timesheets. Analyzing the time spent on specific issue types and projects can reveal opportunities to boost efficiency. Tempo Timesheets makes the time tracking process simpler and more accurate, and it also allows users to create reports that show how team members are spending their time.
- Arsenale Dataplane. For users who rely on advanced charting and analysis of KPIs, Arsenale Dataplane is a must. It allows teams to dig deep into project and issue history to uncover trends, evaluate performance, and even develop their own directory of fully customized reports.
- ScriptRunner. Jira Query Language (JQL) is an essential part of conducting powerful searches, but it has a significant learning curve. ScriptRunner enables teams to take advantage of the search, analysis, and reporting functions that JQL promises without dealing with its complexities. It offers a simple, intuitive way of creating in-depth, precise searches that help users understand trends and enhance their workflows.

Custom Reports
While Jira reports, dashboards, and gadgets are all vital for teams looking to learn from and improve upon their operations, some require more sophisticated capabilities to fulfill their reporting needs. Many modern, data-driven organizations have invested in business intelligence (BI) tools — like Tableau and Microstrategy — to transform their key data into well-informed decisions and strategies.
These companies recognize the additional value of connecting BI platforms with their Jira database. By combining the power of their Jira Server or Data Center environments with the advanced reporting functionalities of their BI solution, teams can more thoroughly customize their reports, merge data from multiple Jira sites, and even integrate data from third-party tools. Premium- and enterprise-level Jira users even have access to Jira Cloud data, so they can run custom SQL queries and reports. The ability to import and analyze data from other sources and create flexible, easy-to-understand reports is crucial for businesses with complex reporting requirements.
Types and Uses of Reports in Jira
The most important consideration to take into account when generating any report is the question you’d like it to answer. If you’re looking to identify the tasks that still need to be finished within a project, for instance, then a report that displays the project’s completed work probably won’t be very useful. Let’s take a look at several key types of Jira reports and how different teams can best use them.
Reports for Kanban Teams
Kanban teams need reports that help them consistently improve their workflows. Try these couple reports to give Kanban teams a leg up at your company.
Cumulative Flow Diagrams
With a cumulative flow diagram, Kanban teams can easily visualize the status of their work. It maps out the stages of the workflow process and displays how tasks accumulate in each stage over time. These reports typically use colored bands across its columns to clearly illustrate the progress of each task and call attention to potential bottlenecks that need addressing.
Control Charts
To quickly identify and eliminate workflow issues, Kanban teams need a grasp on the time they spend on each issue in a particular status. A control chart maps that data over a specific period of time to determine the team’s cycle time for their project. As the variance of that cycle time decreases, the team can better predict future performance. Control charts help Kanban teams set achievable targets and measure the impact of process changes or transitions.
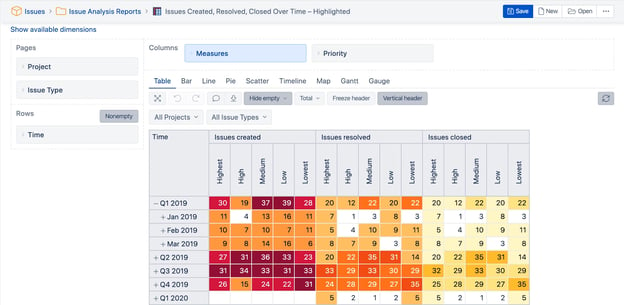
Issue Analysis Reports
Jira offers a variety of reports for analyzing issues to help all teams drill down into the specifics of their work.
Created vs. Resolved Charts
One of the most basic issue analysis reports is the created vs. resolved chart, which compares incoming work with finished work over a given period of time. It’s a simple and effective way for teams to determine whether or not they’re keeping up with tasks as they arise. It provides transparency into the bandwidth, resource allocation, and overall workload of a team.
Average Age Reports
Average age reports illustrate how long open issues have been in their current status, which can help teams determine how long an issue might take to resolve. Over time, average age reports can signify workflow bottlenecks that are preventing team members from resolving issues or identify under-performers.
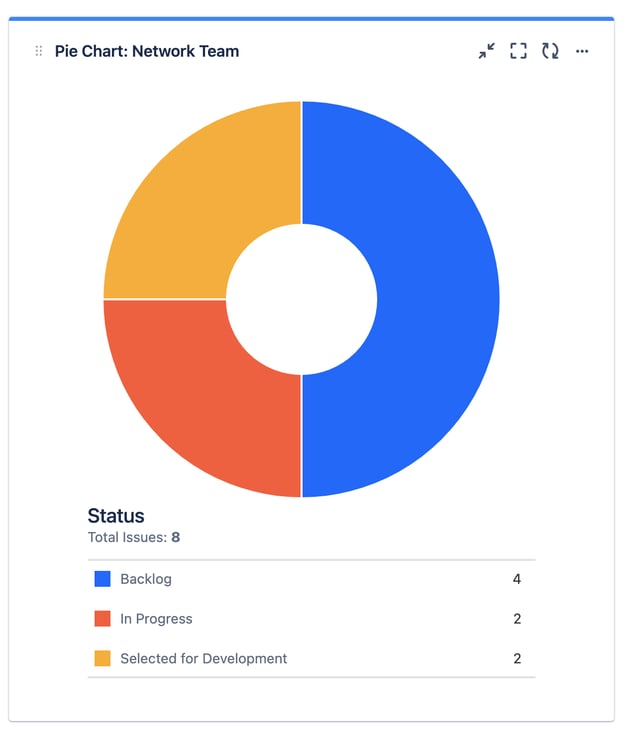
Pie Chart Reports
Jira pie charts enable teams to see the breakdown of issues based on a particular field. If, for example, you want to display the progress of a particular assignee’s issues, you can configure the pie chart to illustrate the number of that user’s issues in each status.
Reports for Scrum Teams
Scrum teams must collaborate, set clear goals, and maintain the flexibility required to complete their work. Here are just a few of the Jira reports they can use to evaluate and boost their progress.
Burndown Charts
Burndown charts enable Scrum teams to visualize and measure their daily completed work against intended deadlines. They display information about the work that the team has already finished and the tasks that must be done within a particular sprint. Scrum teams also use these reports to more accurately predict their likelihood of completing their work within the set time period.
Velocity Charts
Scrum teams use velocity charts to understand the average amount of work they complete during a sprint. The report illustrates the team’s forecasted and finished work across several sprints so they can more precisely estimate the time it’ll take them to work through their backlog. Over time, velocity charts become more accurate and more valuable to Scrum teams, since they’re generated based on historical data. As the team completes more sprints, the report will better reflect the rate at which they’re able to deliver.
Sprint Reports
Sprint reports are great tools for measuring progress mid-sprint and for reviewing a sprint in retrospect. They offer a deep view into all the tasks associated with a sprint, as well as the status of each. Scrum teams use sprint reports to understand whether they’re over- or under-committed and to improve the outcomes and timelines of future sprints.
Epic Reports
Epics differ from sprints in that they’re usually longer, more involved projects that must be broken down into smaller parts for completion, like launching a new website. While sprints are typically organized by blocking a few weeks of a Scrum team’s time to finish a particular set of work, epics are generally broader, more collaborative, time-consuming initiatives.
An epic report helps teams keep track of the sometimes overwhelming amount of tasks required by clearly displaying the progress of each. It shows the amount of estimated work that still needs completing, and highlights the unestimated work, too, giving the team a bird’s eye view into their work.
Keep Jira Reports in Sync With Your Business Strategy
Jira reports are a critical part of understanding and improving your team’s performance. They help you make the most of your project data by offering deep insights into users’ workload, productivity, progress, and more. Once you determine the context and purpose of what you’d like to measure, you can begin generating meaningful reports that help your team reach its objectives.
But before you can reap the benefits of Jira’s reporting capabilities, you need to ensure your deployment is properly tailored to match your business needs — for reporting and beyond. Otherwise, you might be missing out on a fully optimized, data-driven ecosystem that enhances your operations.
The team of experts at Contegix can help your organization get the most out of its Jira instance. From application hosting and optimization, to business process management, to configuration and customization, and much more, Contegix can align your Jira deployment with your business strategy for a more efficient, successful team.
To learn more about how Contegix’s Jira solutions can maximize your team’s productivity and performance, contact us today.